
Best Technical Indicators for Professional Day Traders
Overview of Technical Indicators
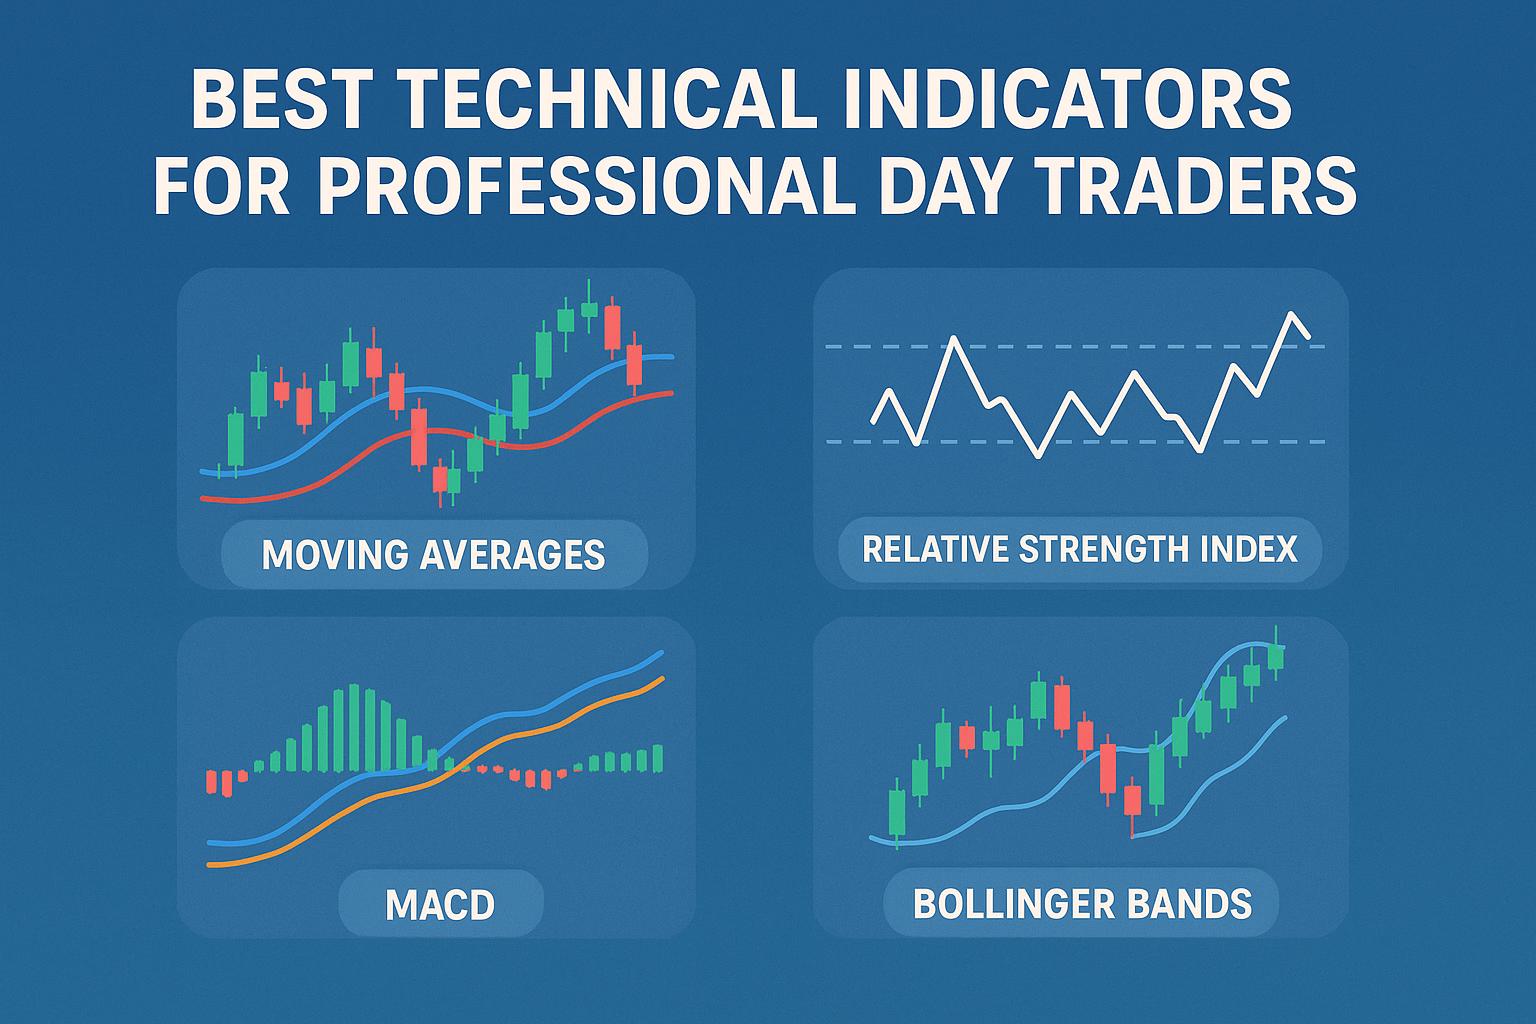
In the world of professional day trading, the use of technical indicators is critical for making well-informed decisions. These tools utilize mathematical calculations based on historical data such as price, volume, or open interest to provide insights into potential future price movements. The application of technical indicators enables traders to interpret market behavior more accurately and make strategic trading decisions. Below is an in-depth exploration of some of the most widely used technical indicators by professional traders.
Moving Averages
Moving averages serve as foundational tools for smoothing out price data, allowing traders to better discern the direction of a trend. They help in removing short-term fluctuations, which can obscure the true market trajectory. There are several types of moving averages, but among the most prevalent are the Simple Moving Average (SMA) and the Exponential Moving Average (EMA).
The Simple Moving Average (SMA) computes the mean of an asset’s prices over a designated period, providing a straightforward overview of price movements. The SMA is particularly useful for identifying long-term trends and can be applied to any timeframe chart. On the other hand, the Exponential Moving Average (EMA) assigns greater significance to more recent prices within its calculation. This makes the EMA more reactive to new information compared to the SMA, which can be beneficial in rapidly changing market conditions.
Using Moving Averages
Moving averages are frequently employed to pinpoint support and resistance levels in trading. These levels serve as psychological barriers where the price may have difficulty moving beyond. Additionally, traders use them to verify ongoing trends. A popular tactic involves monitoring the crossover of moving averages; for instance, when a short-term EMA crosses above a long-term SMA, it may signify a potential buying opportunity. Conversely, the opposite crossover may indicate a selling opportunity.
Relative Strength Index (RSI)
The Relative Strength Index (RSI) is a pivotal momentum oscillator that quantifies the speed and variation of price movements. Its values oscillate between 0 and 100, assisting traders in identifying overbought or oversold conditions of an asset. Typically, an RSI level surpassing 70 suggests that an asset may be overbought, implying a possible impending price correction. Conversely, a level below 30 indicates a potential oversold condition, suggesting that the asset may be undervalued.
Application of RSI
Professional traders leverage the RSI to determine when an asset might be on the verge of a reversal or is maintaining a strong trend. By observing the RSI, traders can make judgments about the momentum and sustainability of a price movement. For comprehensive analysis, the RSI is often used in conjunction with other technical indicators to validate trading signals and minimize the risk of false signals.
Bollinger Bands
Interpreting Bollinger Bands
The primary utility of Bollinger Bands is to signal changes in market volatility. When the bands widen, it signals increased volatility or a potential price breakout. Conversely, when the bands contract, it implies reduced volatility or a potential period of price consolidation. Traders often look for prices to touch or move outside the bands as potential indicators of overbought or oversold conditions, prompting further analysis and possible action.
Moving Average Convergence Divergence (MACD)
The Moving Average Convergence Divergence (MACD) stands as a widely engaged momentum indicator used to signal shifts in trend direction, strength, momentum, and duration. The MACD provides traders with a composite view of the market trends through the examination of the convergence and divergence of moving average lines.
MACD Strategy
In devising trading strategies using the MACD, traders primarily focus on the interplay between the MACD line, the signal line, and the histogram. A common method involves scrutinizing crossovers of the MACD line above or below the signal line. An upward crossover is seen as a bullish signal, whereas a downward crossover is considered bearish. Additionally, observing the MACD histogram can offer insights into the momentum and strength of a trend, helping traders make more informed decisions.
Volume Indicators
Though price is a dominant focus in trading, volume is an indispensable secondary indicator that enriches the analysis of market activity. Volume indicators provide essential insights into the strength of price movements. Popular volume indicators include the On-Balance Volume (OBV) and Volume Moving Average.
Utilizing Volume
Volume indicators are instrumental in confirming price trends and gauging market strength. Sudden volume spikes often suggest an impending trend change or the initiation of a new trend. For traders, correlating price direction with volume changes can validate the authenticity of a move. For instance, a rising price with increasing volume is generally seen as a strong, bullish condition, whereas a falling price on high volume could imply significant selling pressure.
Conclusion
While each technical indicator has its distinct advantages, combining multiple indicators can yield a more comprehensive market analysis. By harnessing a diverse range of technical tools, professional day traders are able to fine-tune their strategies to suit specific market environments and individual preferences. Whether novice or experienced, traders can expand their proficiency through the extensive array of resources available, which delve deeper into these and other advanced analytical tools. With an understanding of technical indicators, traders can better navigate the complexities of the market, enhancing their decision-making and potentially improving their trading outcomes.
This article was last updated on: October 9, 2025