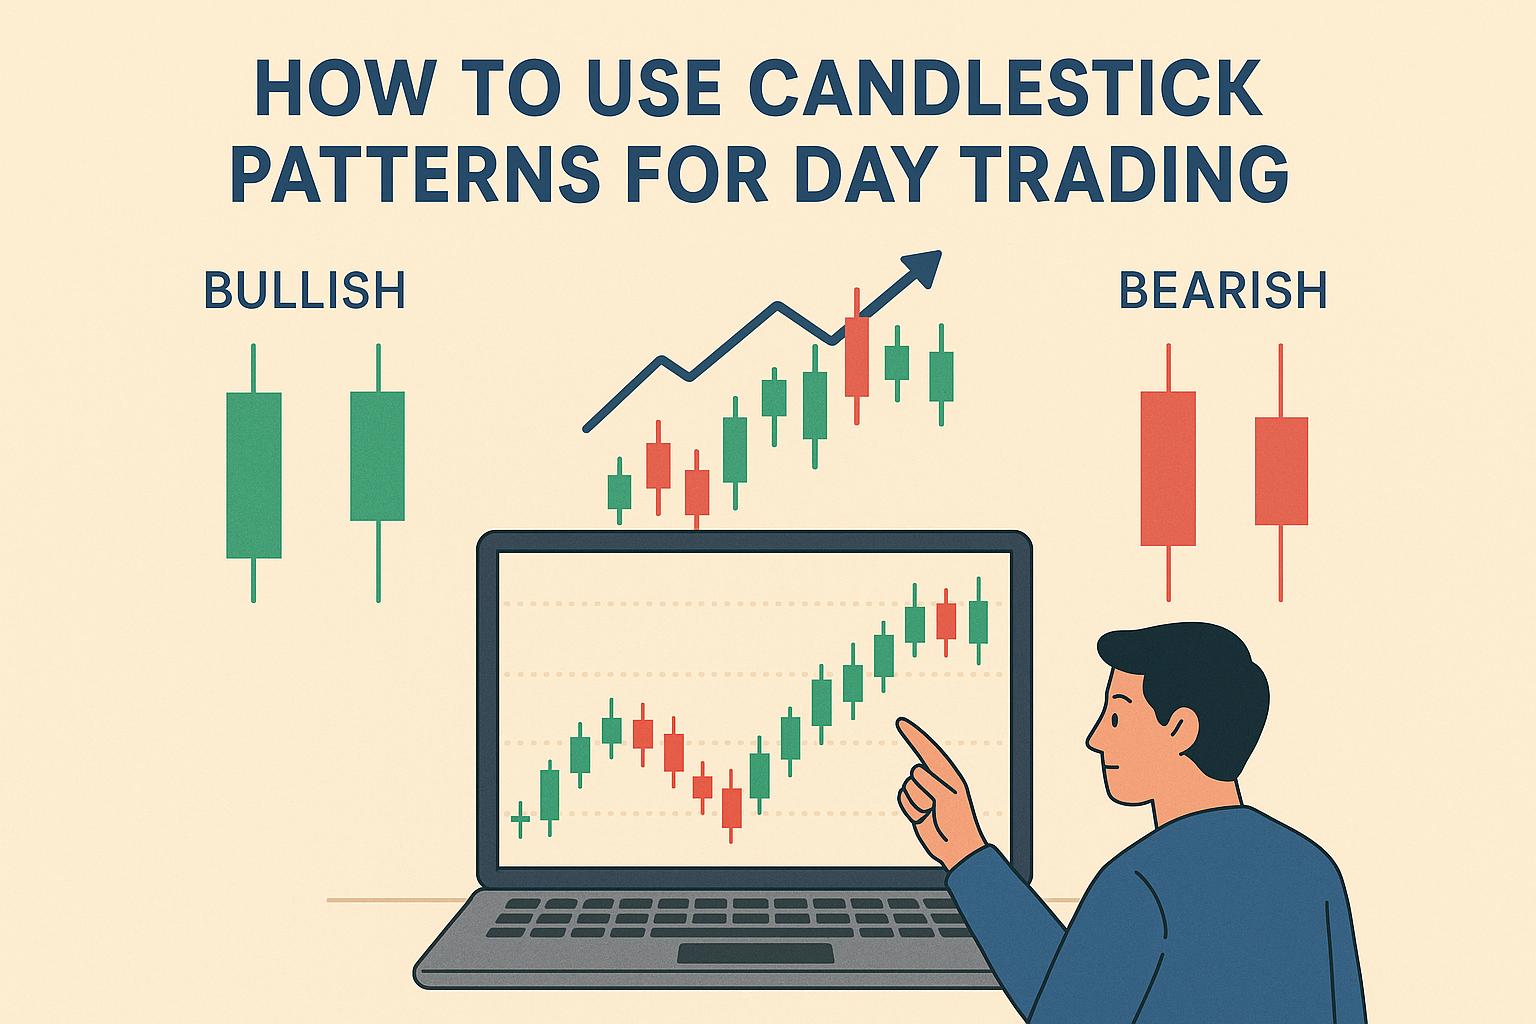
How to Use Candlestick Patterns for Day Trading
Understanding Candlestick Patterns
Candlestick patterns play a significant role in the realm of day trading. They’re an instrumental tool for traders seeking to analyze price movements and make informed decisions in trading. Historically, these patterns trace their origin back to Japanese rice traders, offering visual cues that often reflect market sentiment. Their popularity can be largely attributed to their ability to help traders predict possible price movements through the observation of historical patterns that emerge in the market.
The Basics of Candlestick Patterns
A candlestick pattern is typically composed of one or more candlesticks, with each candlestick relating to a specific time frame. This could range from a minute to an hour, or even a day, depending on the chart’s settings. The fundamental elements of a candlestick include:
– Open: This is the initial price at the commencement of the specified time period.
– Close: This denotes the final price at the conclusion of the time period.
– High: The apex price that has been achieved during the time period.
– Low: This indicates the nadir price reached within that period.
The area between the open and close prices forms the body of the candlestick. Above and below this body are the wicks, also referred to as shadows, which highlight the high and low prices during the period.
Common Candlestick Patterns
Various candlestick patterns exist, each carrying distinct implications. Below are a few of the most commonly observed patterns:
Doji
The doji pattern emerges when the opening and closing prices are almost at parity, resulting in a minimal body. This occurrence is suggestive of indecision within the market. Depending on the surrounding market context, a doji could signal either a reversal or a continuation pattern.
Hammer
Characterized by a small body and an extended lower wick, a hammer pattern frequently marks the conclusion of a downtrend and implies a possible reversal on the upside. This occurs as buyers step in, driving the prices higher.
Shooting Star
In contrast, the shooting star is marked by a small body with a long upper wick. Typically seen at the zenith of an uptrend, it suggests a potential downward reversal. This is a reflection of sellers exerting more influence, pushing prices lower.
Integrating Candlestick Patterns into Your Trading Strategy
Recognizing candlestick patterns alone won’t guarantee trading success; it is crucial to integrate these with other technical analysis tools and indicators to establish a comprehensive trading strategy. To solidify your decision-making, consider blending candlestick patterns with technical indicators such as moving averages, RSI (Relative Strength Index), or MACD (Moving Average Convergence Divergence). These complementary tools can enhance the accuracy of your predictions and provide a broader market view, which is paramount for informed trading decisions.
Practicing with Historical Data
Prior to implementing candlestick analysis in live trading environments, it’s essential to practice with historical data. Utilize a charting platform to conduct backtesting on various patterns and strategies. This exercise aids in deepening your comprehension of pattern formation under different market conditions and eventually boosts the confidence needed to apply them effectively in real-time trading.
Constantly Update Your Skills
Given that the market is ever-changing, successful traders are those who persistently update their knowledge and skills. Being informed about the emergence of new patterns, evolving strategies, and shifting market conditions is crucial. Engage in continuous learning by attending seminars, enrolling in online courses, or following reputable trading blogs. These activities will ensure you stay ahead, effectively adapting to market changes and broadening your trading arsenal.
Conclusion
Candlestick patterns present a valuable toolset for day traders, equipping them with insights into potential price movements. Nonetheless, these patterns should not be isolated from other analytical forms. By incorporating additional in-depth analysis, refining various strategies through practice, and maintaining a commitment to continuous learning, traders can significantly enhance their decision-making processes. This approach not only broadens their understanding but can also potentially improve their odds of achieving success in the volatile trading market.
This article was last updated on: October 9, 2025